Adam Tamer Get in touch
Applied ML · Predictive maintenance

Satellite fleet health.

A predictive-maintenance system for a simulated 50-satellite constellation. It reads each spacecraft's telemetry, estimates the chance that every subsystem degrades within 14 days, and turns that risk into a recommended action.

  1. 01 · SimulatePhysics-grounded telemetry180 days per satellite from Kepler orbits, atmospheric drag and station-keeping burns.
  2. 02 · EngineerTrend and step featuresRolling 7- and 30-day mean, spread and slope, plus change-point scores that catch sudden faults.
  3. 03 · PredictOne model per subsystemFive random forests. Thresholds tuned by cross-validation across satellites, tested on ones they never saw.
  4. 04 · DecideTraceable actionsA deterministic rule engine links each risk to a recommendation and the reading behind it.
🛰️ Honest by design: every score, status and action below is computed by the project's trained models, not scripted.
How to read this
  • Satellite #43, the fleet's worst, replays its 180 days: battery fading, bus heating, fuel running out, then orbital decay once station-keeping stops.
  • Colours show drift from the satellite's own first-20-day baseline. They are an indicator for this view; the formal risk scores and statuses come from the models below.
  • The satellites are simulated; the physics and the machine learning are not. 3D model: NASA's Suomi NPP.
—
Satellites
—
Avg fleet health
—
Nominal
—
Watch
—
Warning
—
Critical
↓
Fleet overview

Every satellite, scored.

Live-scored snapshot from the real pipeline: feature engineering → five trained classifiers → per-satellite health scoring.

Constellation by orbital plane Walker layout
Faults by subsystem satellites not nominal
NominalWatch WarningCritical · Tap a satellite to open it
Satellite drill-down

Inside one spacecraft.

Full 180-day telemetry history for one satellite, subsystem status, and the model's 14-day risk estimate.

Subsystem guide what each one does and what to watch

180 days of telemetry 14-day failure risk from the model, top right of each chart

Shaded band = this satellite's normal range, learned from its first 20 days (mean ± 3σ).

Recommended actions

From risk score to what to do next.

Every action traces to a concrete telemetry reading: a deterministic rule engine, not a black-box suggestion.

SatPrioritySubsystemStatusRecommended action
How it was built

Three decisions that mattered.

In the order they were discovered.

01

The physics is real, and it drives the story

Orbital period comes from Kepler's Third Law; altitude decay from a drag model derived from the energy-rate balance on a circular orbit — both pinned by unit tests against known values (a 400 km orbit's ~92.6 min period; GEO reproducing one sidereal day to 0.1%). Each satellite spends propellant on periodic station-keeping burns; when the tank runs dry, the drag model takes over and the orbit starts decaying on its own — the signal that triggers the deorbit recommendation, not a hardcoded rule.
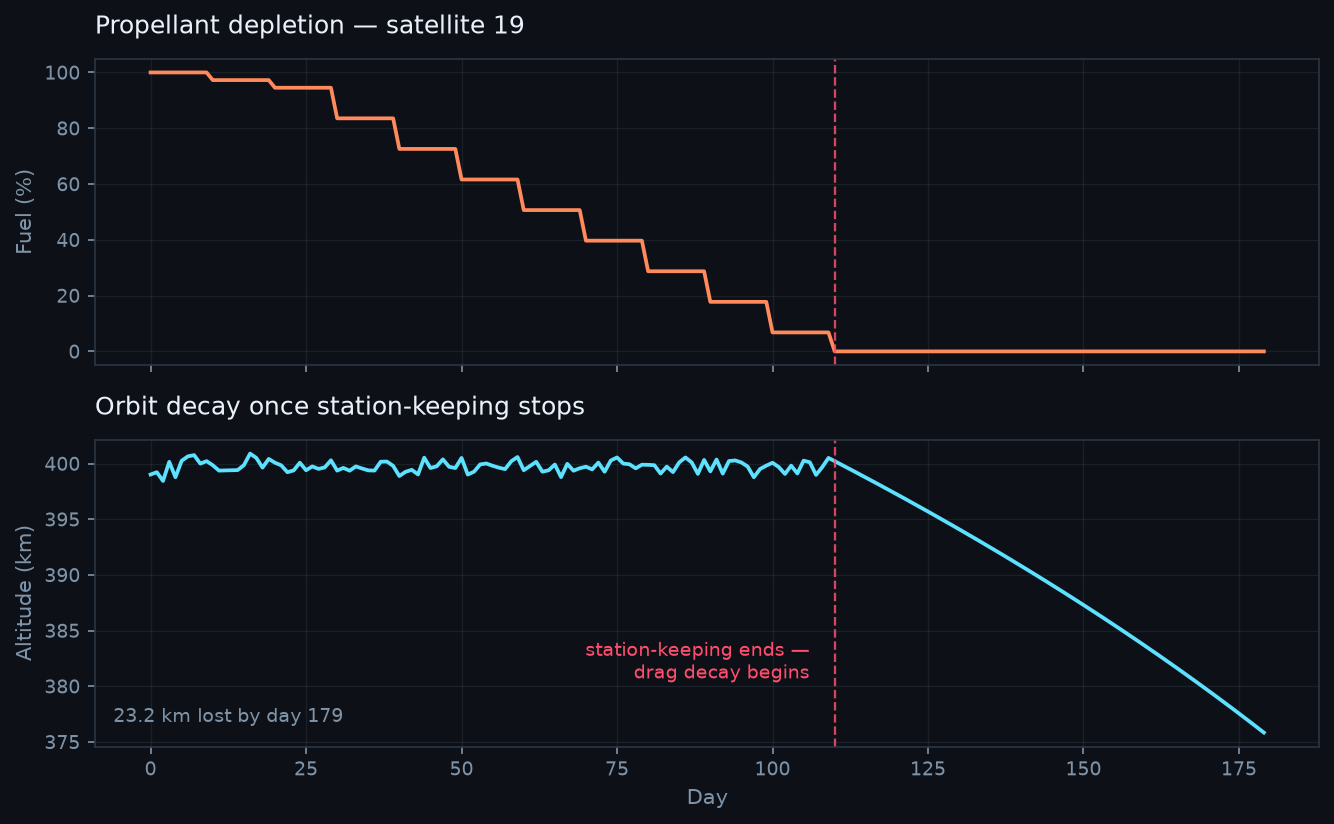
Fuel depletion and orbital decay chart
Fuel runs out at day 110; altitude that had been held flat for months begins falling: 23 km over the remaining 70 days.
02

A model that didn't work taught the most

Four subsystems degrade gradually — trend features (rolling mean/std/slope) handle them well. Comms doesn't: its fault is a step, and a 30-day trend window straddling a step gets swamped by the step itself. The first comms model scored 0.27 precision / 0.09 recall while every drift subsystem sailed through. The fix was a second feature family: change-point detectors comparing against a baseline lagged far enough back to exclude the step being detected.
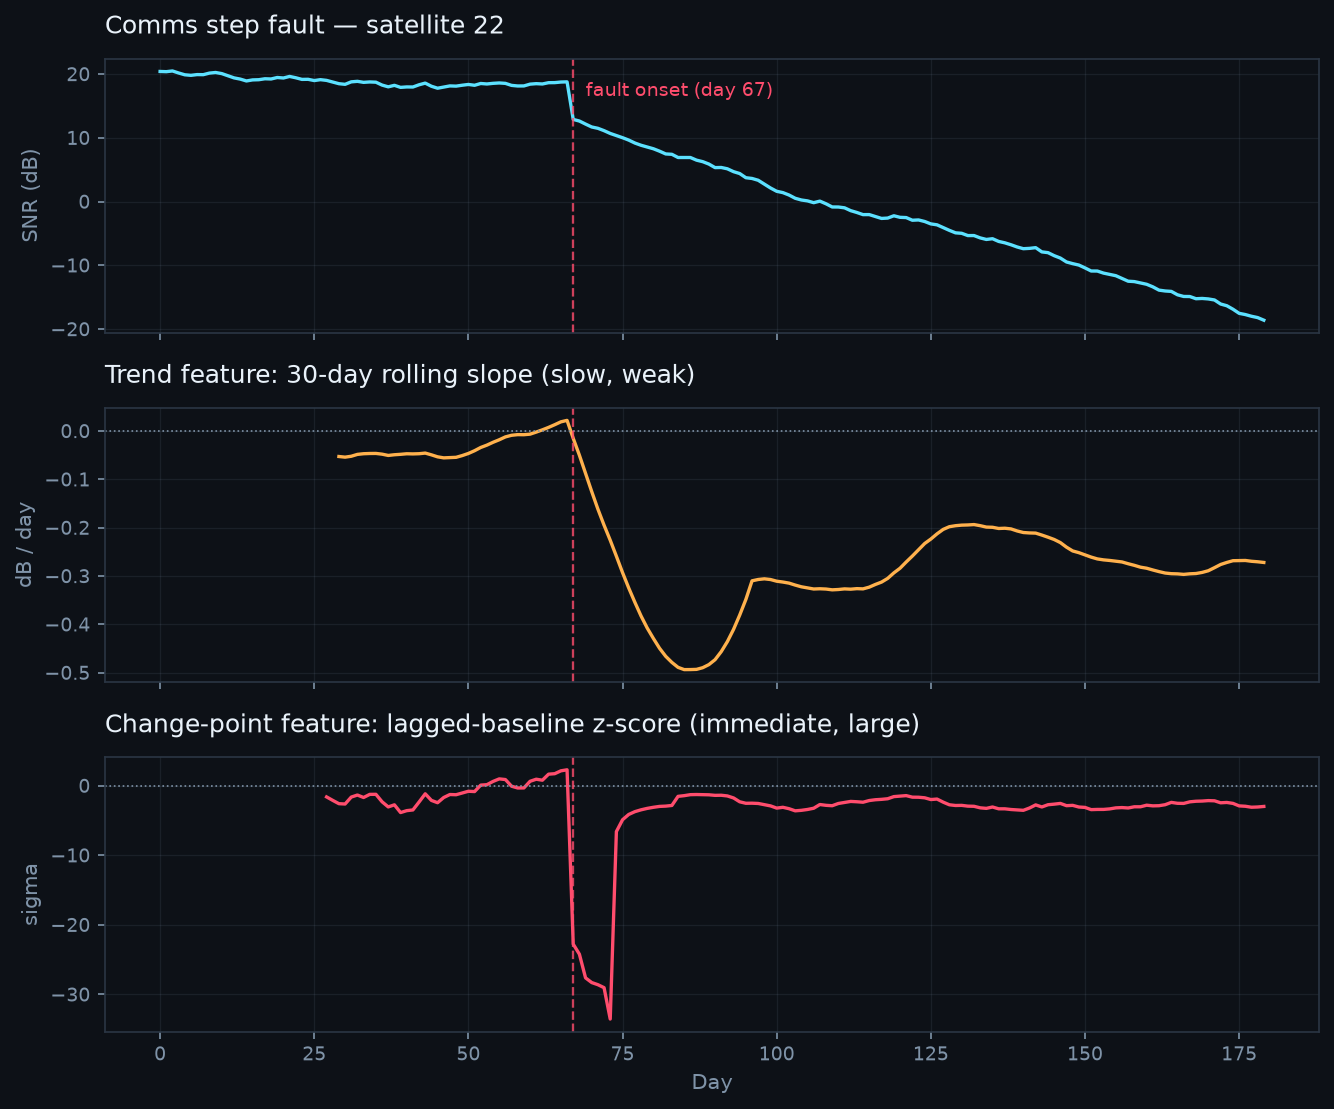
Change-point vs trend feature response chart
Change-point z-score reacts the same day as the fault; the 30-day trend slope takes ~20 days to catch up.
03

The bigger problem was the threshold, not the features

The comms model's ROC-AUC was 0.97 — it was ranking almost perfectly. Positive cases averaged probability 0.31 against 0.03 for negatives, but scikit-learn's default 0.5 cutoff sat above nearly all of them. Each subsystem now gets its threshold chosen by GroupKFold cross-validation on the training satellites only, maximizing F1 on out-of-fold predictions. Comms went from F1 0.14 to F1 0.89.
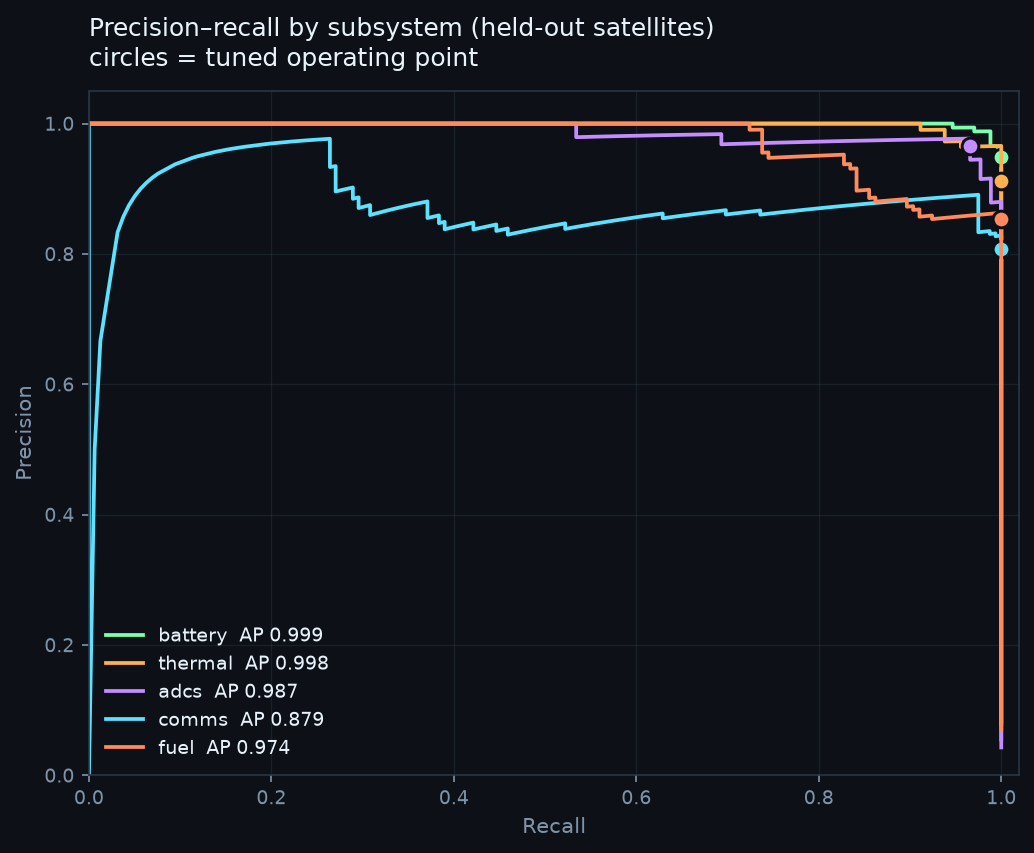
Precision-recall by subsystem chart
Precision-recall by subsystem after per-subsystem threshold tuning; comms visibly remains the hardest case.
Final results

Held-out test satellites.

Scored on satellites the models never saw during training or threshold tuning.

SubsystemROC-AUCAvg. precisionThresholdPrecisionRecall
Battery1.0000.9990.0790.951.00
Thermal1.0000.9980.3250.921.00
ADCS0.9990.9870.2050.980.97
Comms0.9940.8790.2750.811.00
Fuel0.9980.9740.3140.861.00